THE CHALLENGE:
Monitoring nutrient levels within soil represents an important step in maximising the yield and quality of your harvest, but manual sampling methods are laborious and inefficient. As traditional, direct monitoring of nutrient content in soil by collecting and analyzing soil samples is time-consuming and expensive, manual sampling is not suitable for frequent use during the season. In addition, taking small numbers of samples across a field offers little analytical value and means that variation can be overlooked. Regular nutrient analysis, made possible by remote sensing, can help us tackle these problems.
Satellite nutrient monitoring and Artificial Intelligence can have a transformative role in helping growers to save on fertilizer and labour costs, reduce their environmental impact, while maximizing their crops’ yields.
THE SOLUTION:
Remote sensing from satellite imagery can help producers identify nutrient deficiencies in a cost-effective and timely manner. Even by using historic soil samples, we can produce detailed analysis without setting foot on the field. Regular monitoring of spatial variation in nutrients, made possible by remote sensing, can help to inform more precise long-term nutrient application strategies by helping to identify seasonal patterns in nutrient distribution across a grower’s fields and farm. This can also result in additional savings on fertilizer while helping to reduce over-application and the negative environmental effects associated with this practice.
HOW IT WORKS:
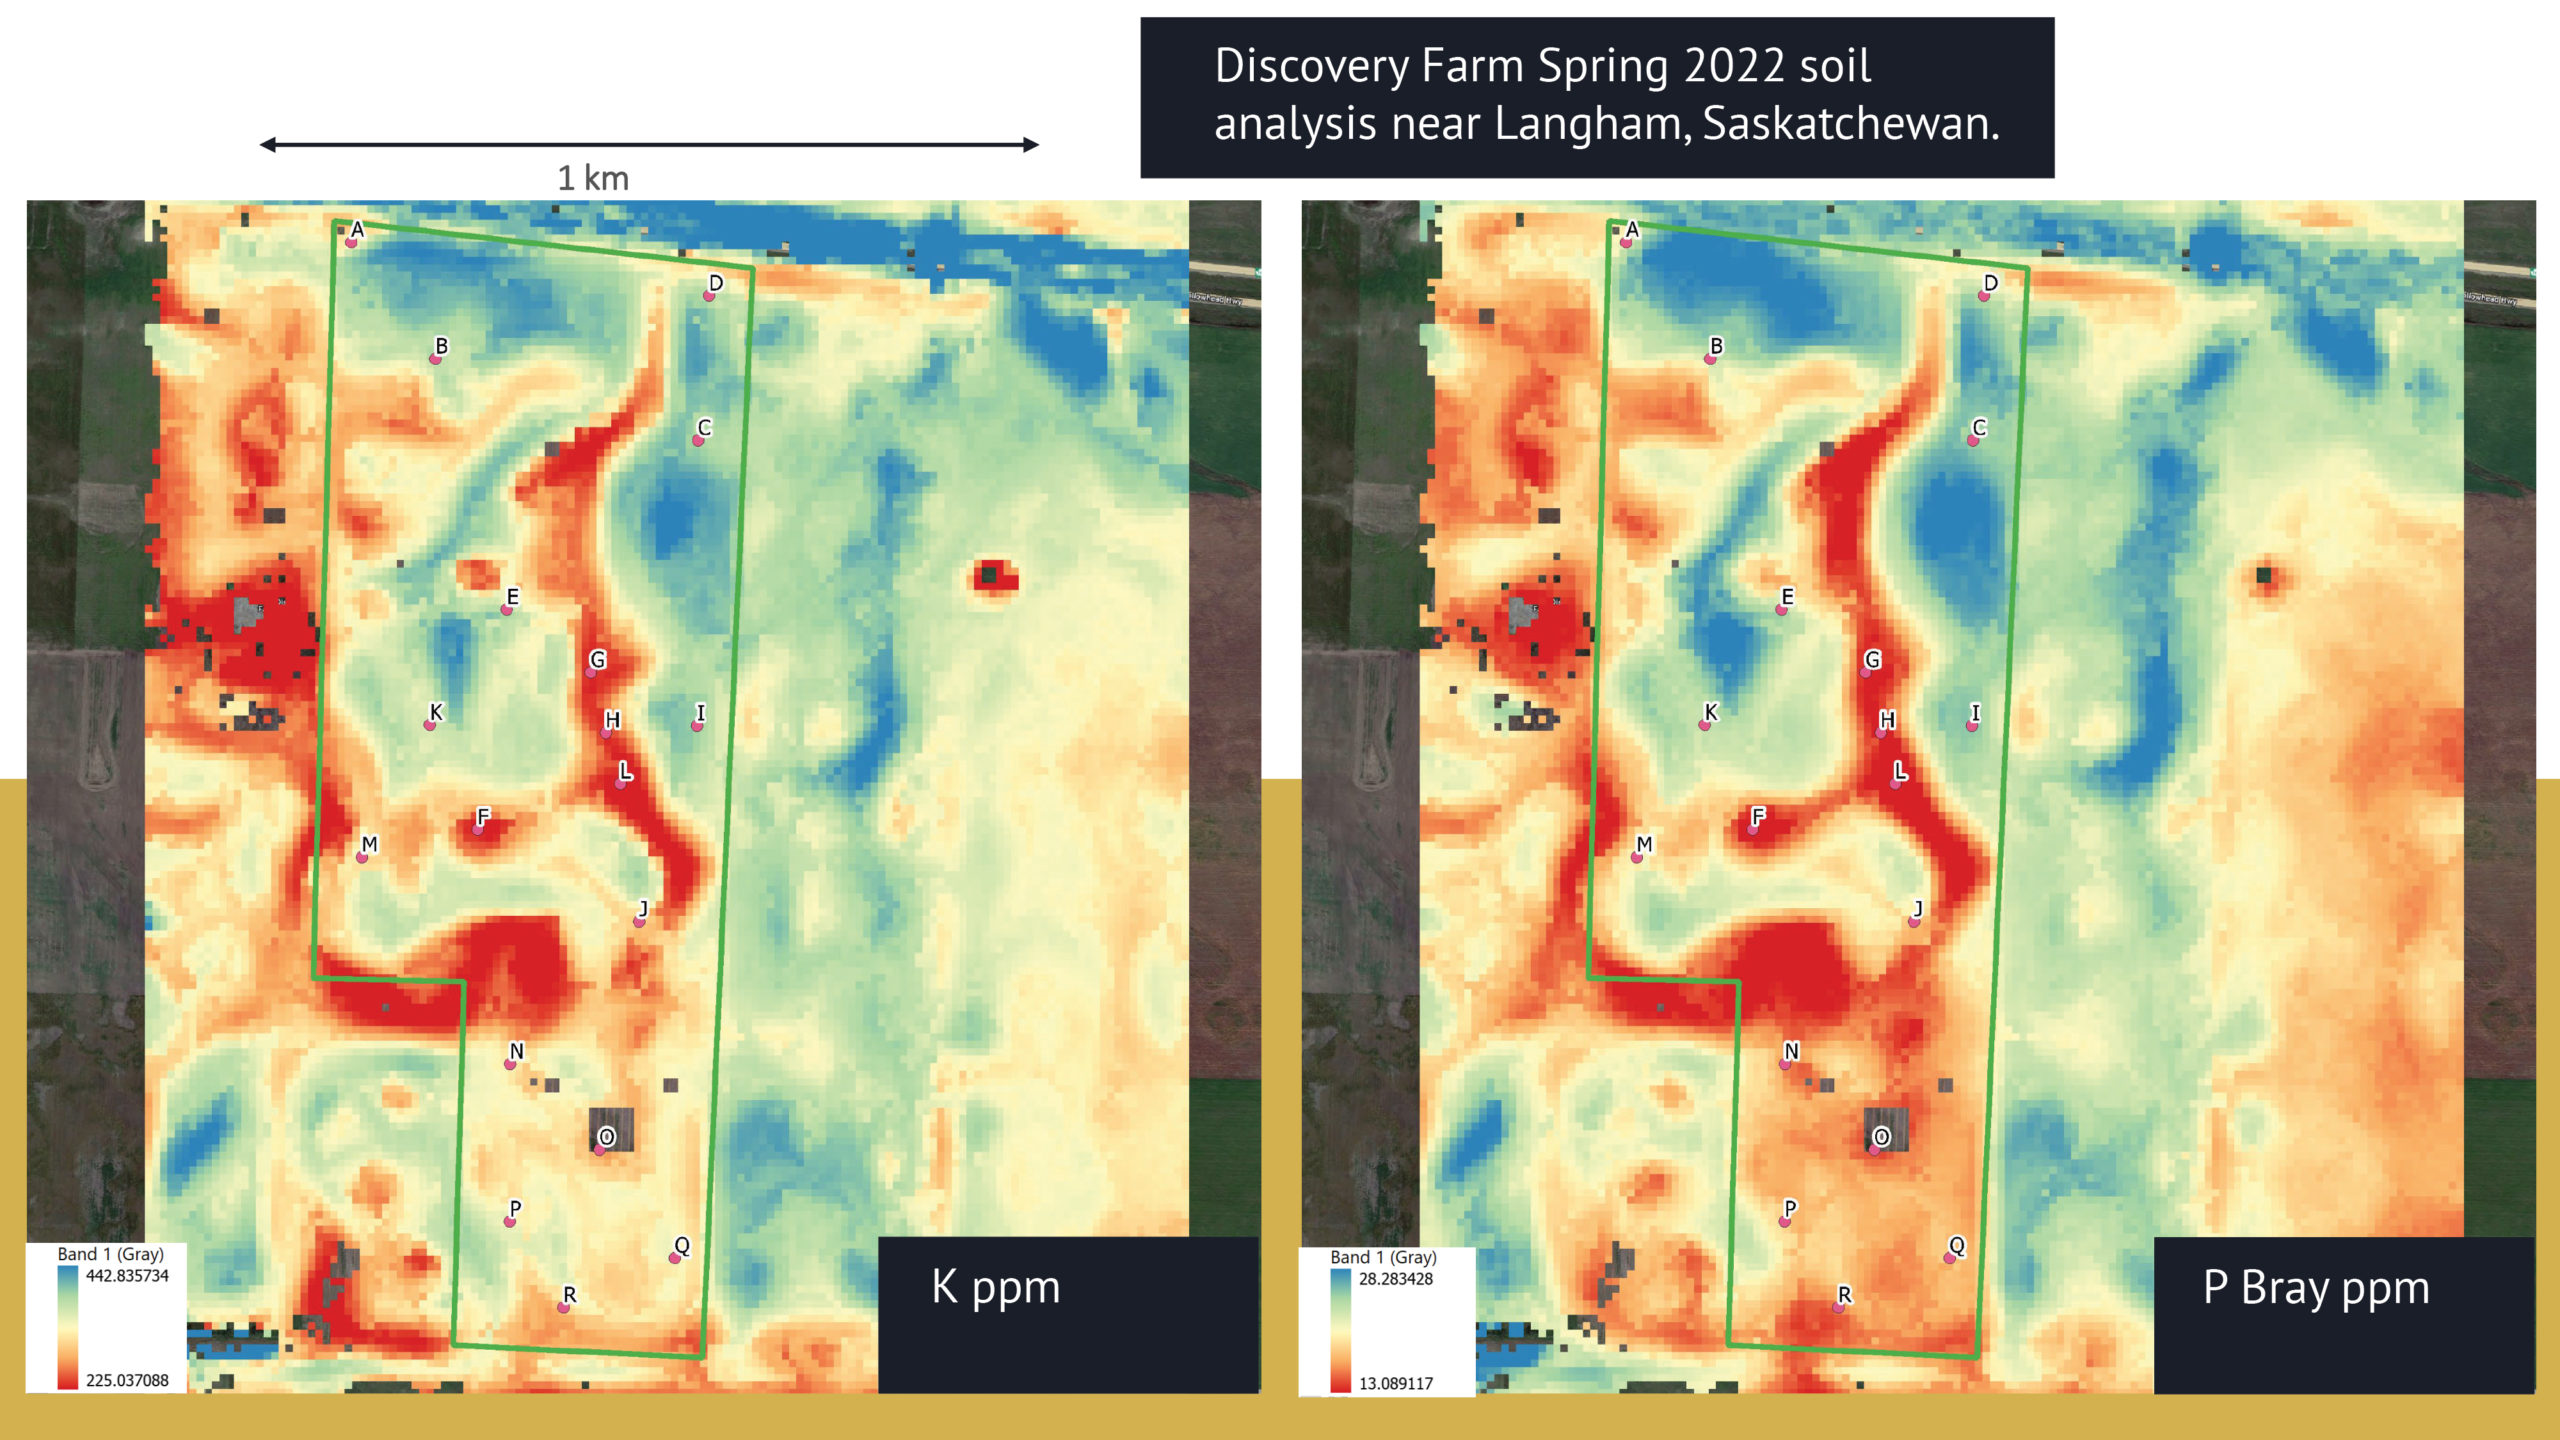
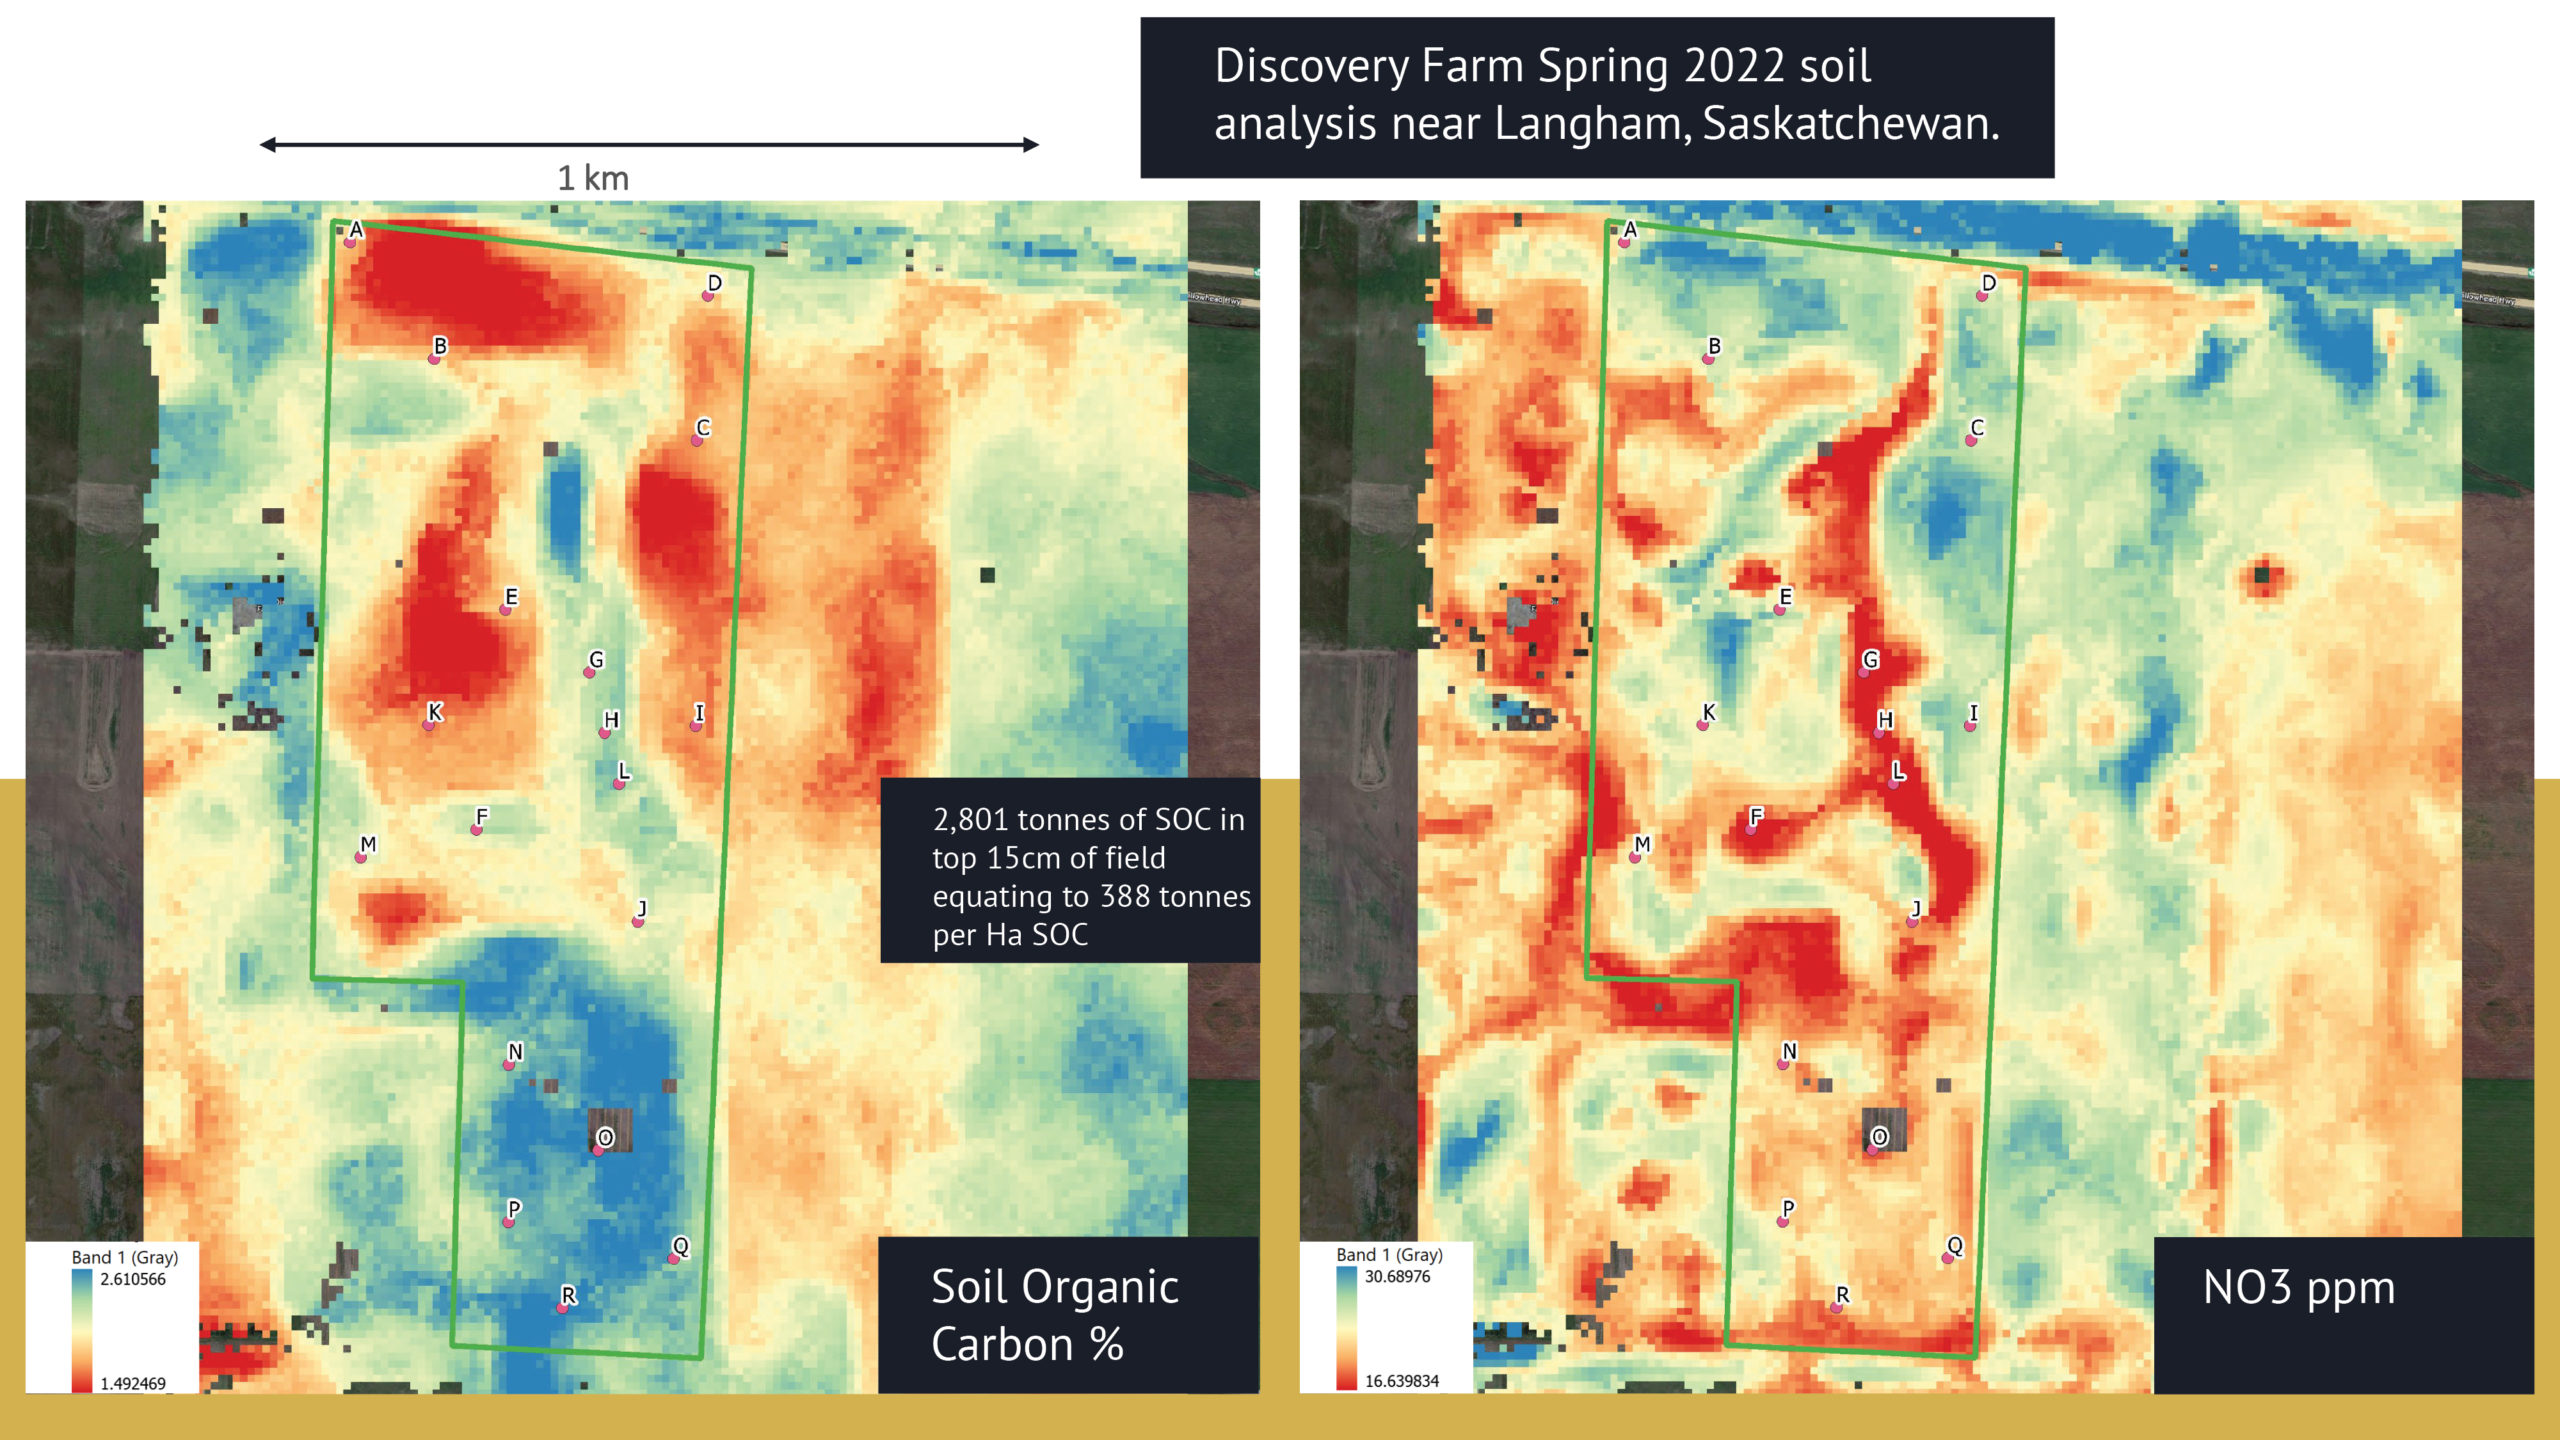
Axiom XACT Agriculture utilizes AI (Artificial Intelligence), deep & machine learning, along with proprietary algorithms that are trained in Western Canadian soil, nutrient, and vegetation analysis. Using multispectral and hyperspectral satellite data and advanced machine learning technologies together we are able to analyze the spatial distribution of soil nutrients in agricultural fields and monitor changes in the content of the main nutrients (N, P, K) of crop plants.
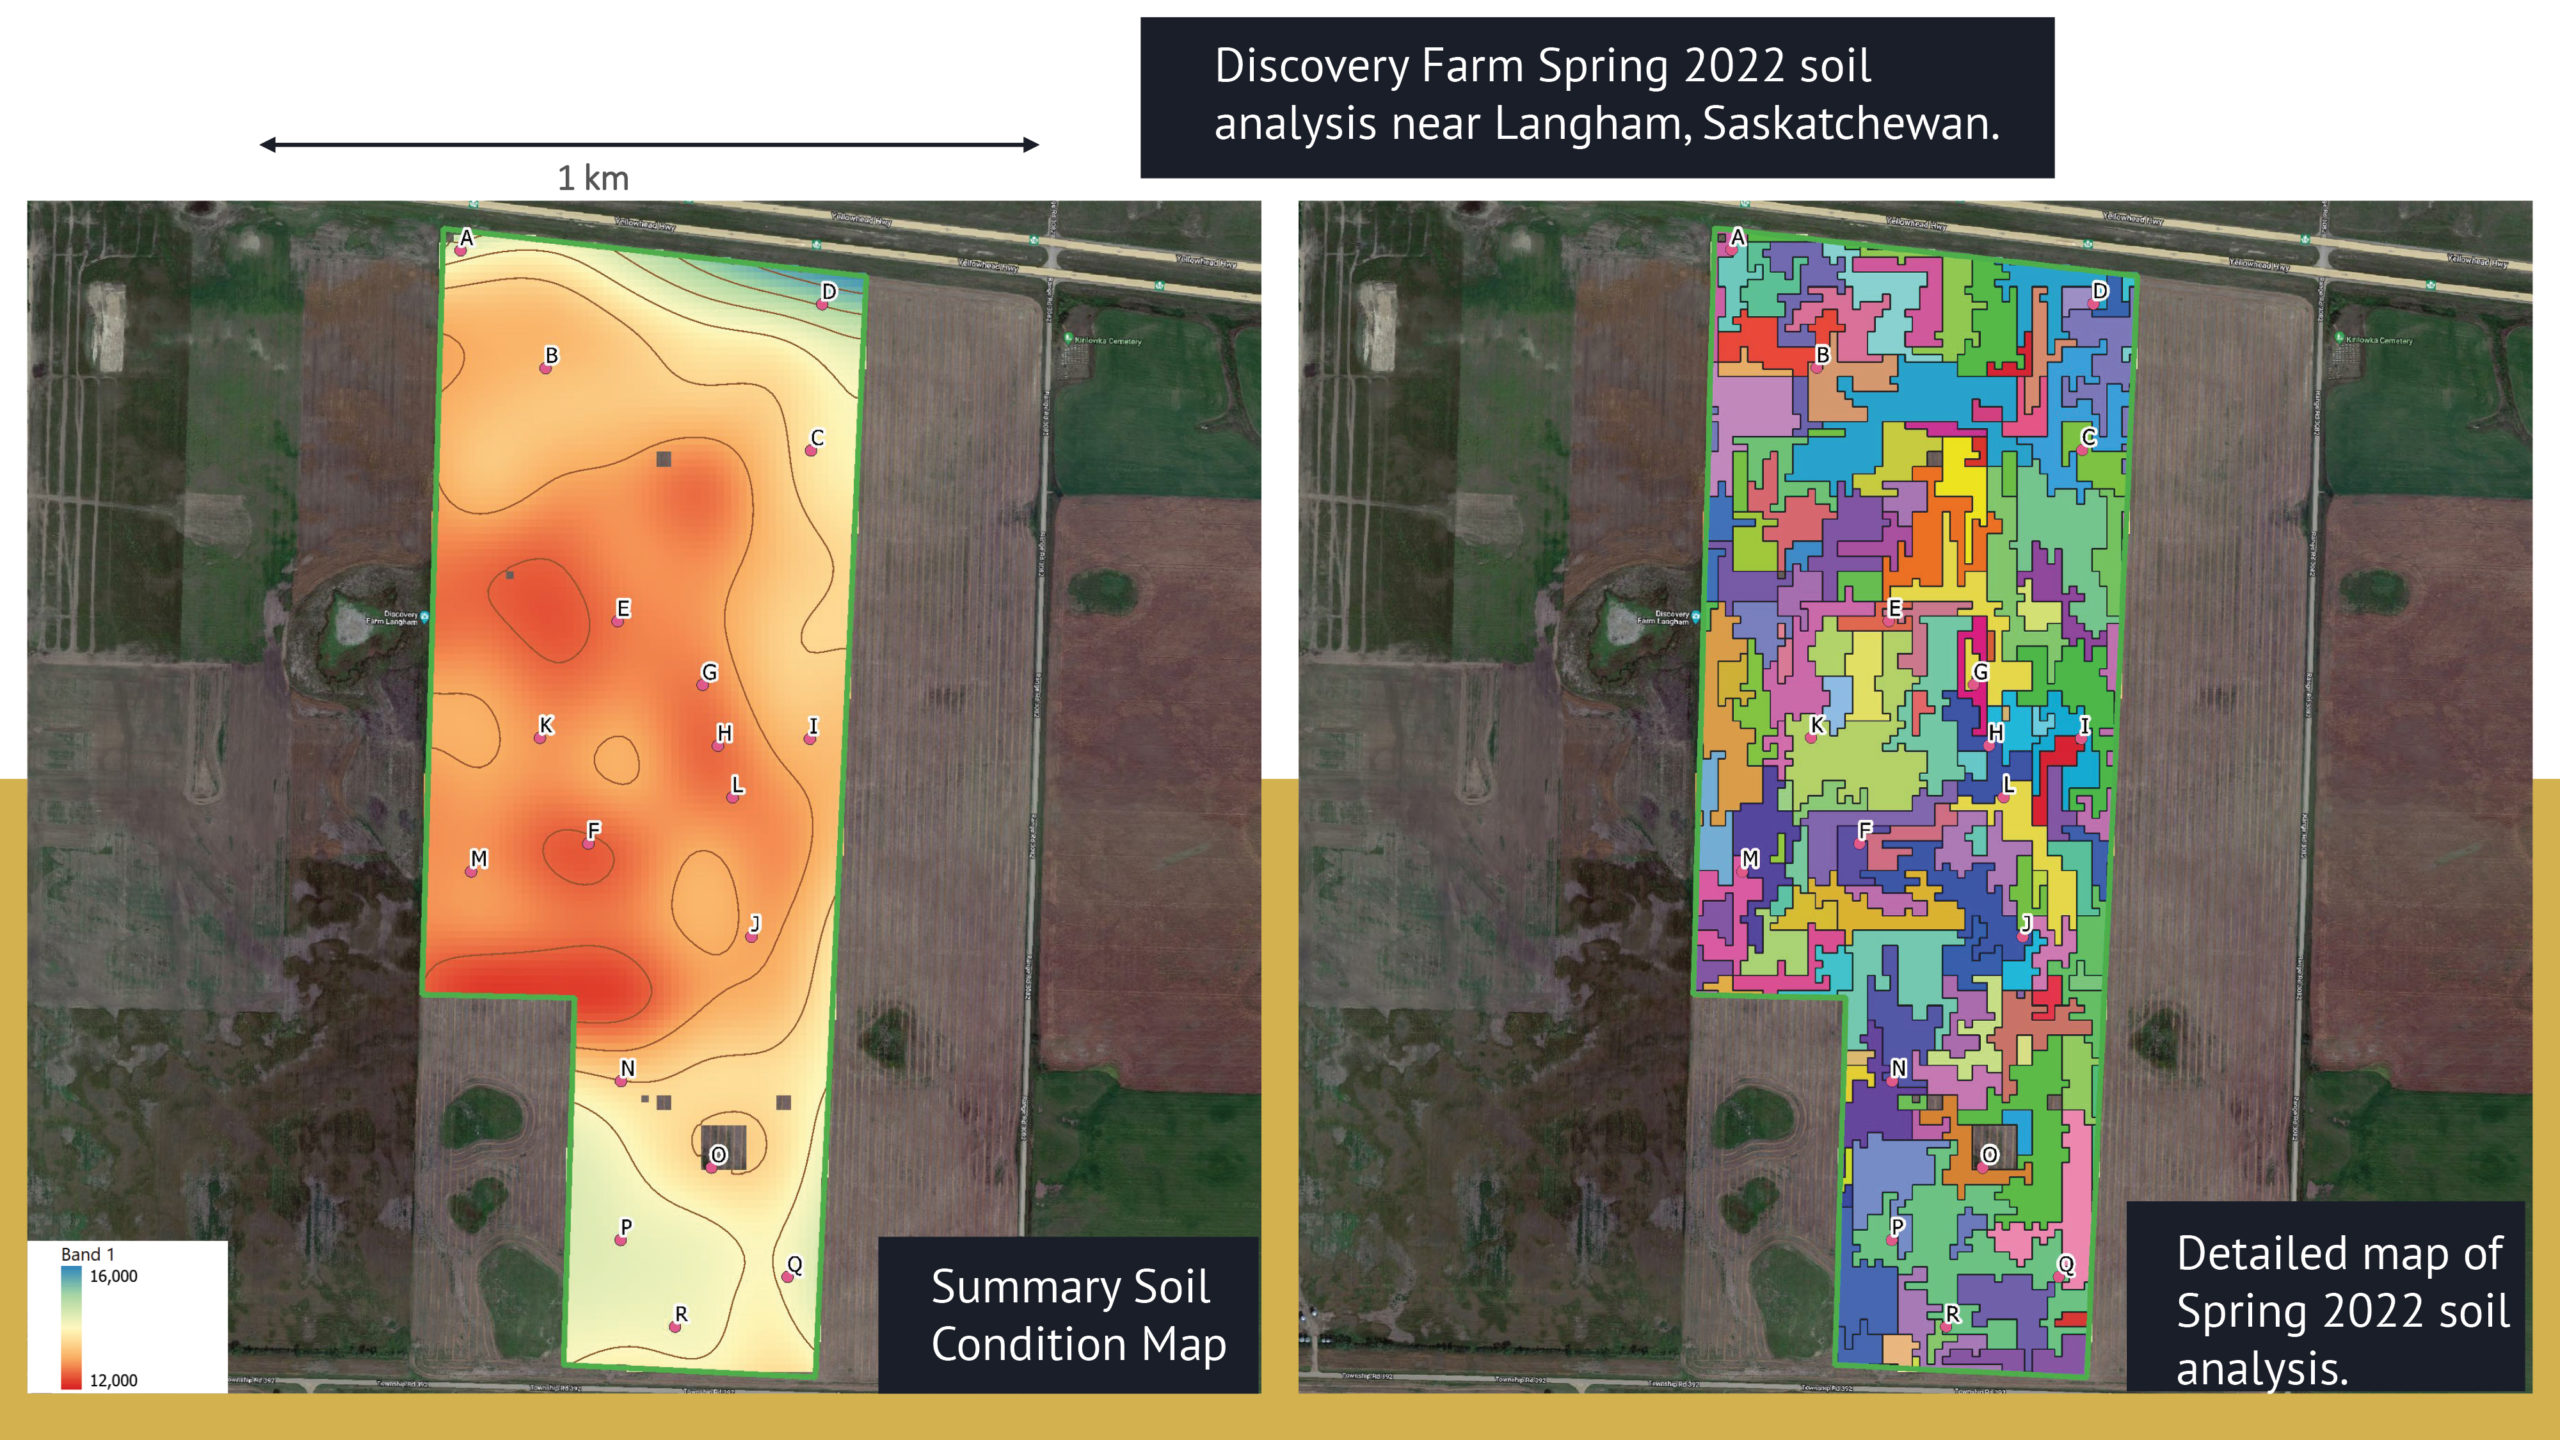
Each coloured segment on the sample maps have values for the minimum, maximum, average and standard deviation for each of the organic matter and all the nutrients and micronutrients. This allows us to develop recommendations for farmers on the amount of fertilizer to apply to a whole field or more precise areas within a field to drive yield increases during the season. In addition, only 10 soil samples are required per satellite scene (109 km x109 km) to ground truth our model.
We analyze changes of nutrient content in agricultural fields using time series of high resolution satellite imagery and the vegetation indices calculated from them. Our team has run numerous experiments, utilising the full spectrum of satellite imagery and over 800 samples of Saskatchewan soil, to assess accurate digital signatures that identify each specific nutrient. This allows us to observe the general health state of the vegetation cover in the field of each specific crop,
as well as to identify problem areas and anomalies that may indicate a deficiency of a particular nutrient.
By comparing the distribution of nutrients and the temporal change in their levels across a field with yield data at the end of the season we can even make strong conclusions on the contribution of different factors to the changes in yield without taking new samples each season.


